
Personal project
QuadLake Indonesia
Turning fragmented building-footprint files into inspectable regional reporting data.
Investigation question
How can building-footprint data become useful regional evidence without hiding coverage gaps?
Public data & scope
Microsoft’s Global ML Building Footprints are distributed in many tile files. QuadLake assembles the Indonesia subset and joins footprints to administrative boundaries for country, quadkey, province, and district reporting.
The figures below are original Tableau exports from the public project repository, retrieved on 7 October 2026. Their exact underlying imagery dates vary; they should not be read as a current building census.
Validation between stages
Bronze parses the line-delimited geospatial records and preserves source metadata. Silver normalizes the schema and assigns row identifiers. Gold uses representative points for spatial joins, then aggregates and reconciles the outputs.
Unmatched rows remain inspectable. A nearest-boundary recovery step supplies an approximate assignment rather than silently discarding them. The command-line entry point runs each stage with checks for file mappings, geometry fields, identifiers, and totals.
Analytical exhibit
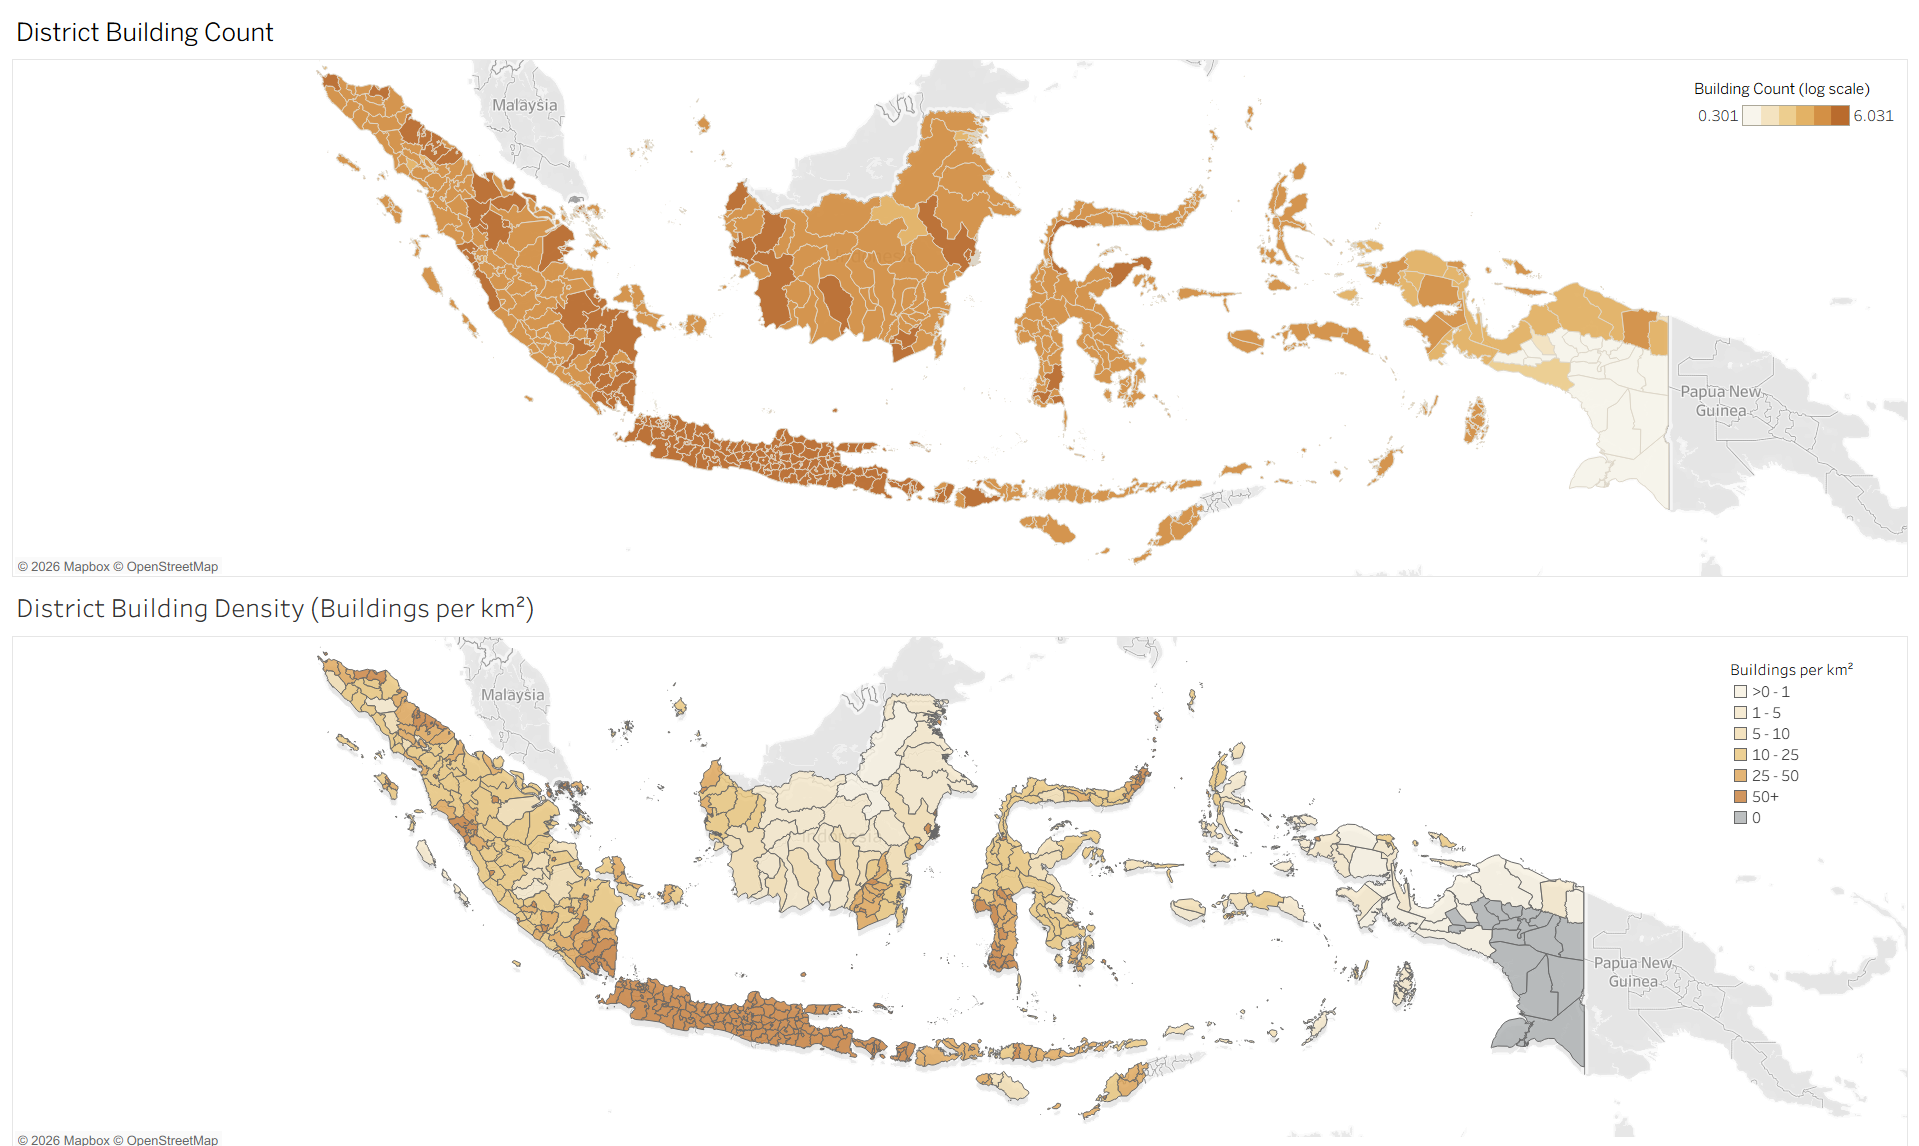
Original Tableau export: district counts show footprint volume; area-normalized density shows concentration. Java has broad concentrations in both views, while parts of Papua appear in the zero-density group.
Microsoft building footprints with geoBoundaries administrative context; original Mapbox/OpenStreetMap attribution retained. Exact per-district values are not recoverable from this image alone.
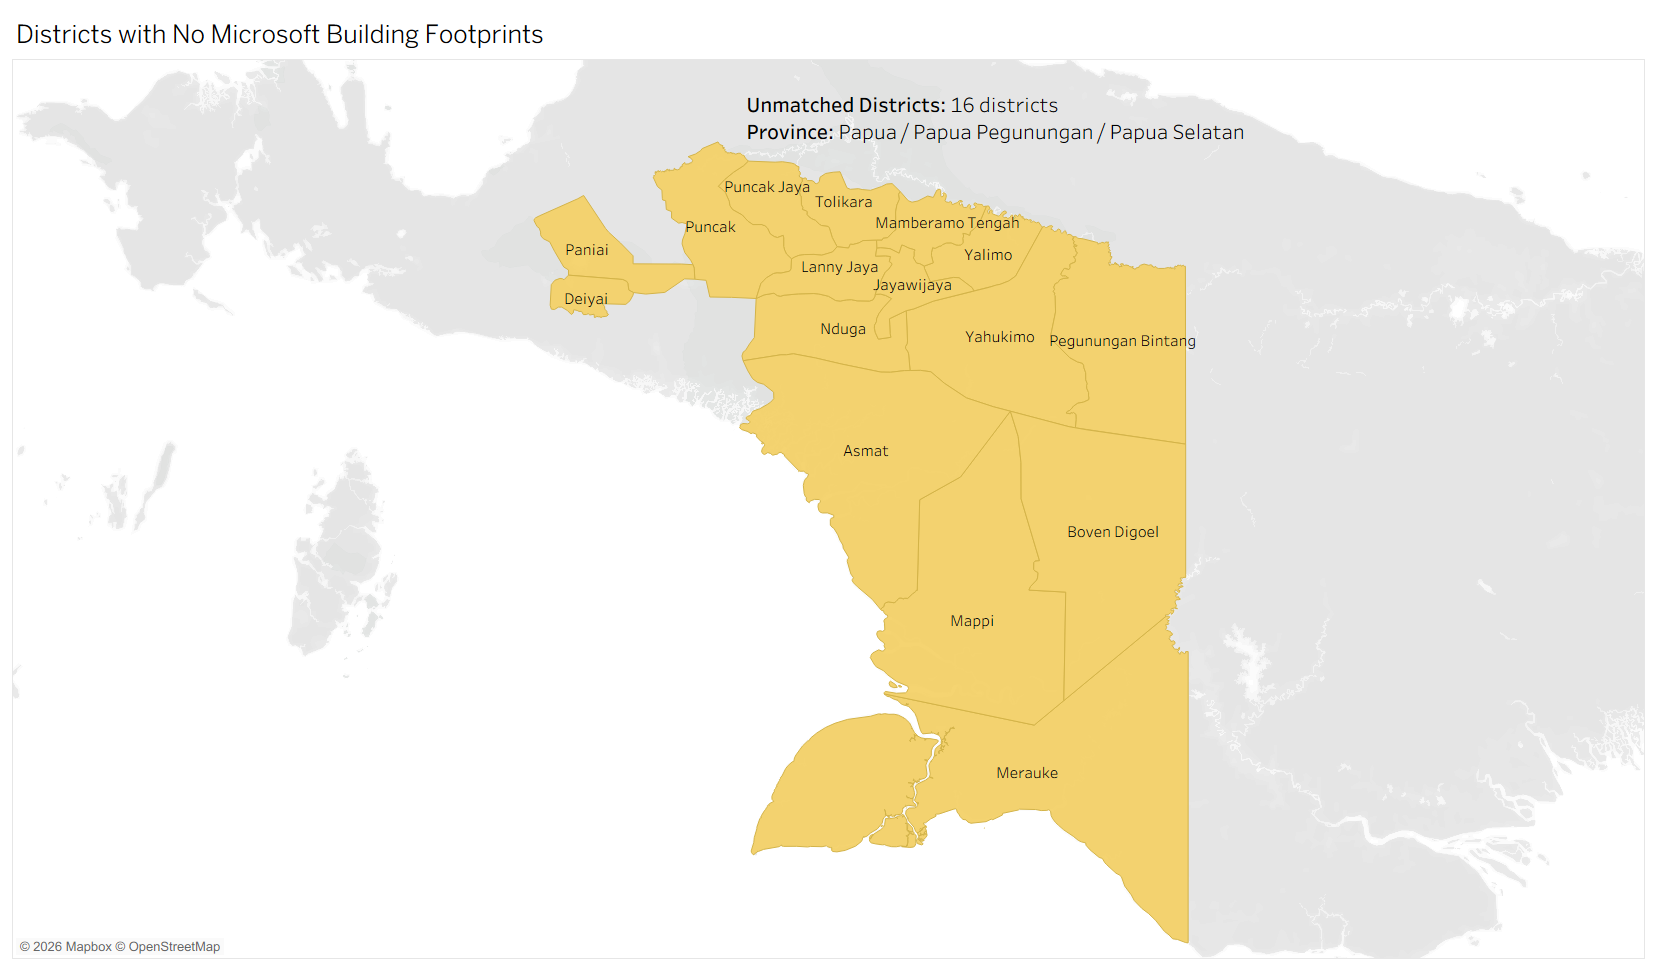
The published project snapshot reports 519 boundary-reference districts: 503 with footprints and 16 without. Zero footprints indicate a coverage gap, not an absence of buildings.
Counts describe the project’s boundary reference and published snapshot. They are not a statement about current administrative totals or complete building coverage.
View data table
| Coverage | Districts |
|---|---|
| Boundary reference | 519 |
| With footprints | 503 |
| Without footprints | 16 |
Keep scale and density separate
Total footprint count describes volume. Dividing by district area adds concentration, so the reporting layer shows both. The count map uses a log scale; the density map has a separate legend in footprints per square kilometre.
Coverage is a third question. A district with zero footprints is flagged for inspection instead of being interpreted as having no buildings.
Coverage qualifies the comparison
The published reporting snapshot identifies 16 districts without assigned Microsoft footprints. This is a dataset-coverage result, not a finding that those districts lack buildings.
The count and density views answer different questions. Reading them alongside coverage avoids treating a large total, a compact district, and a missing-data area as equivalent signals.
A dataset, not a census
Machine-derived footprints can be missing or inaccurate, and imagery dates vary. District definitions and area calculations affect density. Nearest-boundary recovery is approximate; the code uses Web Mercator for that distance-based step.
These are the project’s published figures, not a new recomputation of its full dataset. The repository does not contain the complete raw and Gold files needed to reproduce every displayed value here.
Further exploration
The public repository provides the pipeline, CLI, validation logic, and original figures. A useful next step is to publish a versioned reporting extract and inspect recovered assignments before adding finer-grained density analysis.
Personal contribution
I built the Bronze, Silver, and Gold pipeline and CLI, with validation, spatial assignment, and reconciled reporting outputs.