
Public & personal work
Projects
Questions, investigations, and the evidence behind them.
Featured project Personal project
KarhutlaWatch
Satellite thermal detections, placed in geographic and temporal context across Indonesia.
Investigation question
Where and when do satellite fire detections concentrate across Indonesia?
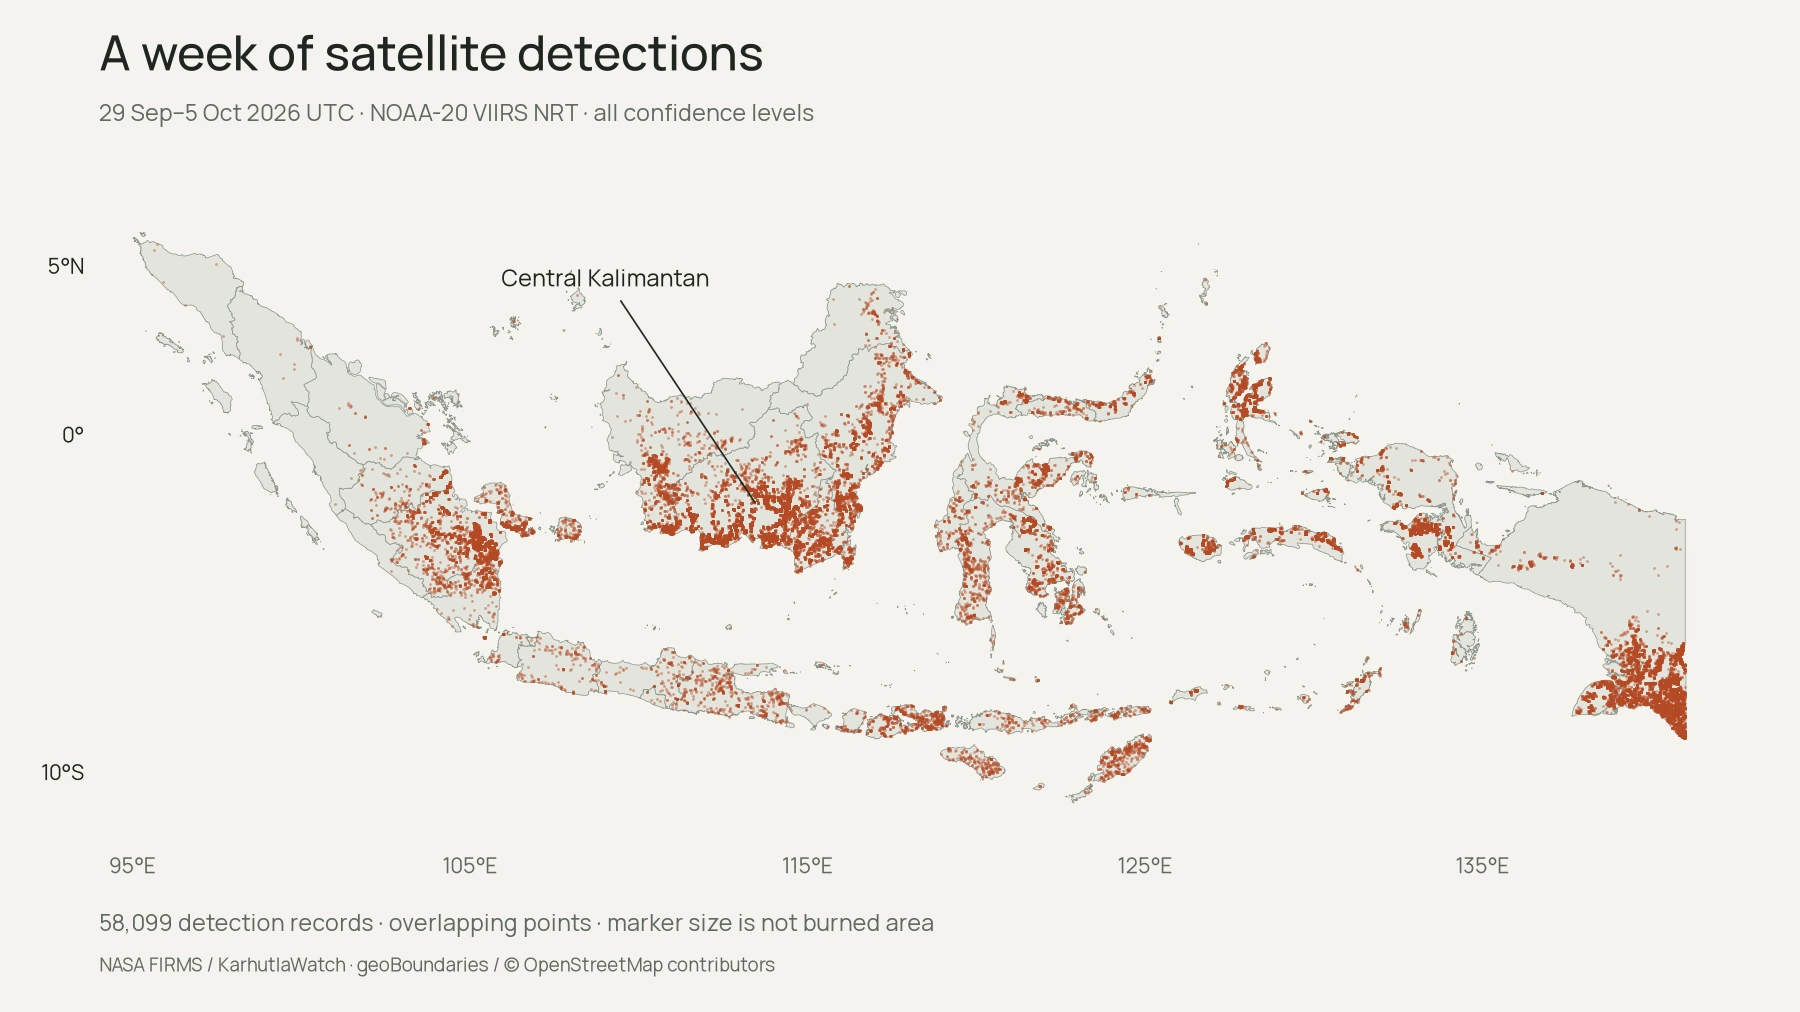
View data table
| Province | Detections | Share |
|---|---|---|
| Central Kalimantan | 14,530 | 25.0% |
| Papua | 9,695 | 16.7% |
| South Sumatra | 7,998 | 13.8% |
| West Papua | 4,012 | 6.9% |
| East Kalimantan | 3,250 | 5.6% |
| Maluku | 2,539 | 4.4% |
| South Kalimantan | 2,474 | 4.3% |
| North Maluku | 2,215 | 3.8% |
| West Kalimantan | 2,207 | 3.8% |
| Central Sulawesi | 1,243 | 2.1% |
| South Sulawesi | 1,187 | 2.0% |
| East Nusa Tenggara | 1,028 | 1.8% |
| Southeast Sulawesi | 1,018 | 1.8% |
| Bangka-Belitung Islands | 822 | 1.4% |
| West Nusa Tenggara | 771 | 1.3% |
| Lampung | 672 | 1.2% |
| Jambi | 613 | 1.1% |
| East Java | 550 | 0.9% |
| North Sulawesi | 336 | 0.6% |
| Gorontalo | 174 | 0.3% |
| Central Java | 165 | 0.3% |
| West Java | 155 | 0.3% |
| West Sulawesi | 145 | 0.2% |
| North Kalimantan | 118 | 0.2% |
| Riau | 81 | 0.1% |
| Banten | 45 | 0.1% |
| Bali | 10 | 0.0% |
| North Sumatra | 10 | 0.0% |
| Riau Islands | 9 | 0.0% |
| Special Region of Yogyakarta | 7 | 0.0% |
| Aceh | 6 | 0.0% |
| Bengkulu | 6 | 0.0% |
| West Sumatra | 6 | 0.0% |
| Jakarta Special Capital Region | 2 | 0.0% |
- Period
- 29 Sep–5 Oct 2026 UTC · snapshot retrieved 7 Oct 2026
- Aggregation
- 58,099 records · all confidence levels · project province labels
- Limitations
- Detections are not confirmed fires or burned area. Older boundary labels are retained.
Purpose
Satellite thermal detections, placed in geographic and temporal context across Indonesia.
Personal contribution
I built the public dashboard and automated pipeline: ingesting NASA FIRMS data, assigning regions, aggregating observations, and tracking repeated activity.
Further investigations
Selected Work
More public and personal work.
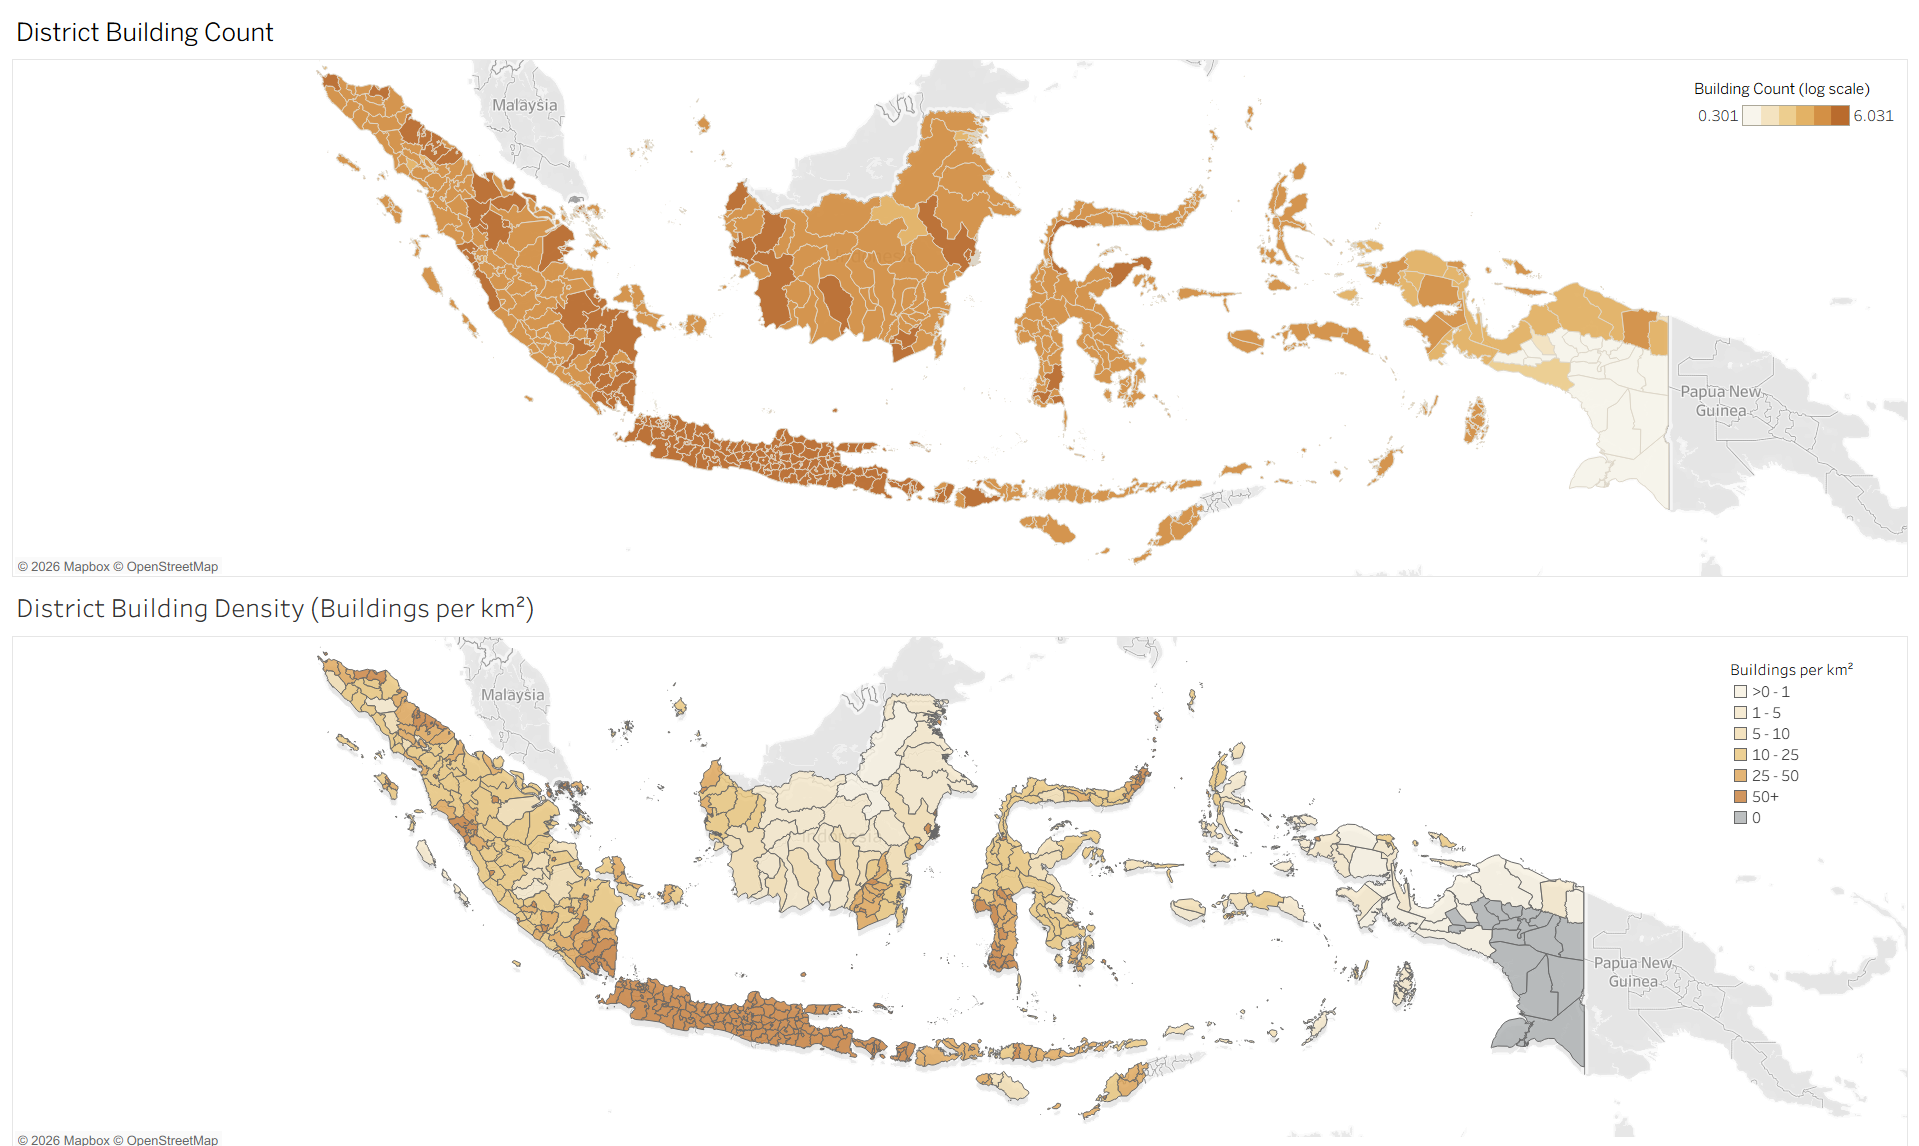
QuadLake Indonesia
Personal project
Turning fragmented building-footprint files into inspectable regional reporting data.
I built the Bronze, Silver, and Gold pipeline and CLI, with validation, spatial assignment, and reconciled reporting outputs.
Read case study