
Personal project
KarhutlaWatch
Satellite thermal detections, placed in geographic and temporal context across Indonesia.
Investigation question
Where and when do satellite fire detections concentrate across Indonesia?
Public data & scope
KarhutlaWatch uses NASA FIRMS VIIRS NOAA-20 near-real-time thermal detections. Each record describes an observed pixel, not a separately confirmed wildfire. geoBoundaries provides the administrative context.
This exhibit fixes the period at 29 September–5 October 2026 UTC, using the public repository snapshot retrieved on 7 October. It includes all three confidence categories. The latest stored date, 6 October, is excluded because that snapshot may still be partial.
From observations to a question
The Python pipeline transforms FIRMS observations with Polars, assigns province and district labels through spatial joins, and stores the results in Parquet. The Streamlit interface makes geographic, time, and confidence filters available alongside maps and daily trends.
For this case study, I retained the project’s region assignments, counted records by province and UTC acquisition date, and divided each provincial count by the national total. The map and both charts use exactly the same seven-day subset; a downloadable CSV and accessible tables make the result inspectable.
Analytical exhibit
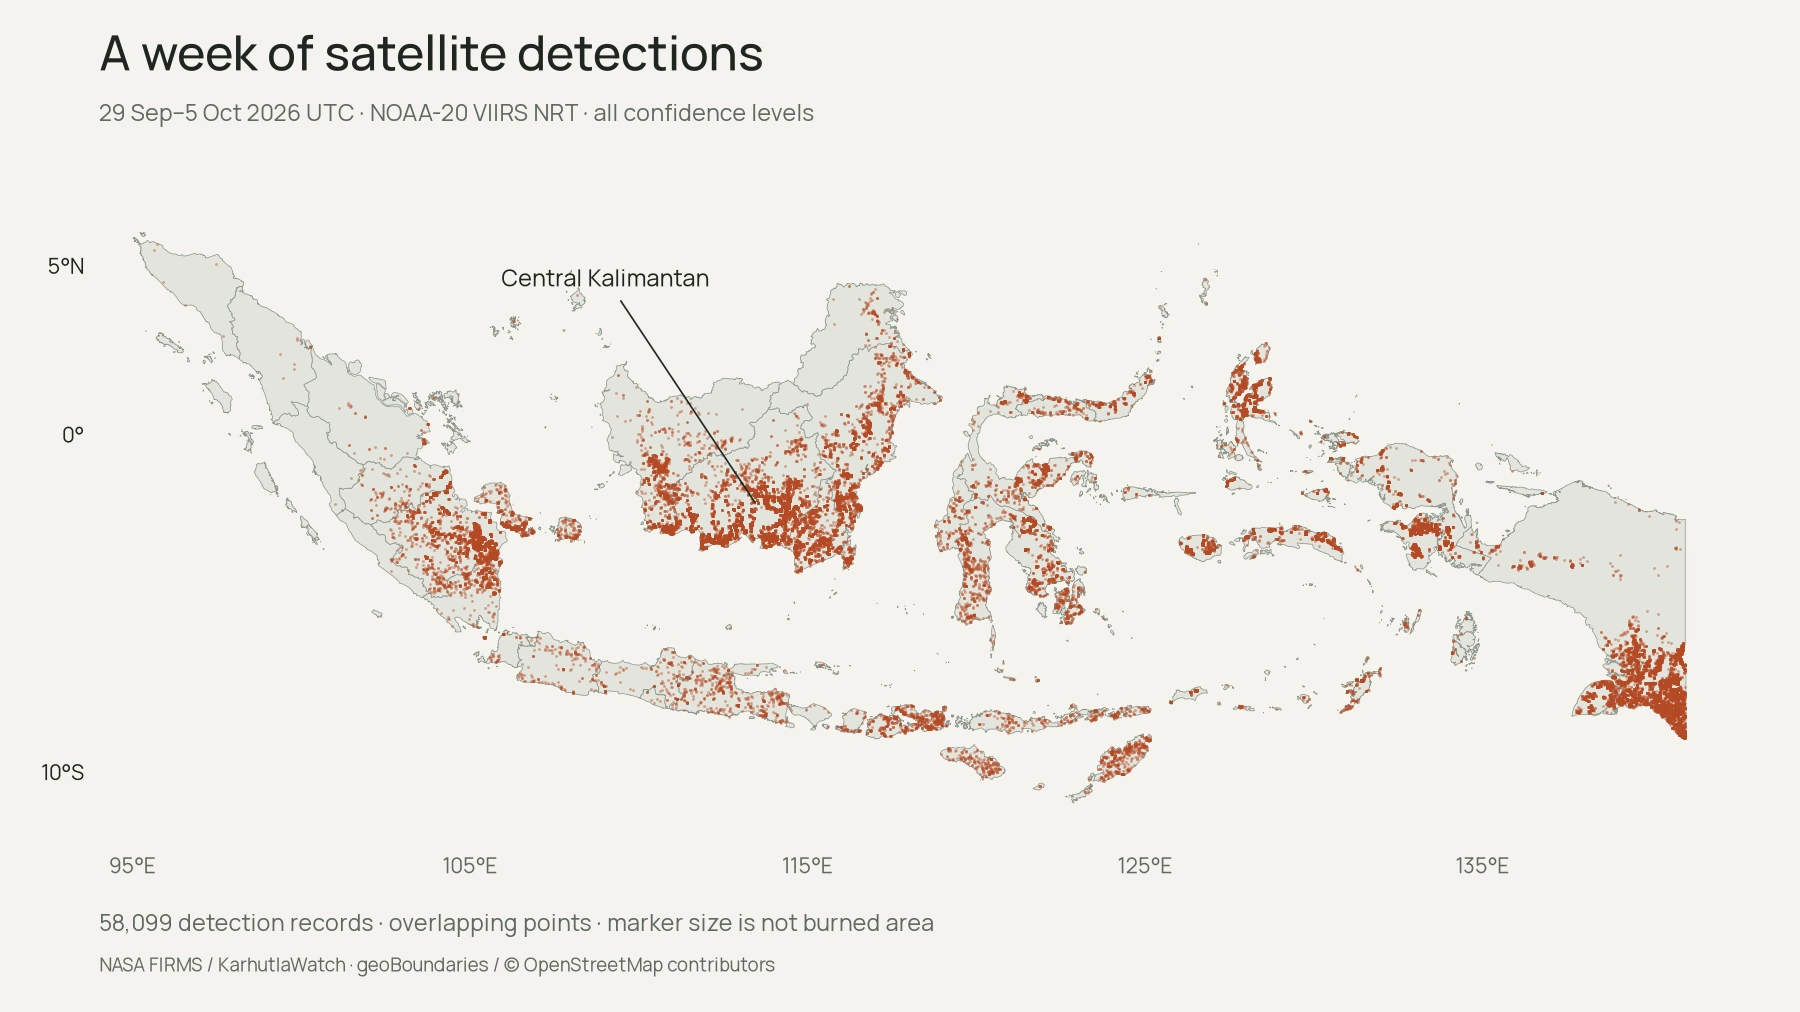
View data table
| Province | Detections | Share |
|---|---|---|
| Central Kalimantan | 14,530 | 25.0% |
| Papua | 9,695 | 16.7% |
| South Sumatra | 7,998 | 13.8% |
| West Papua | 4,012 | 6.9% |
| East Kalimantan | 3,250 | 5.6% |
| Maluku | 2,539 | 4.4% |
| South Kalimantan | 2,474 | 4.3% |
| North Maluku | 2,215 | 3.8% |
| West Kalimantan | 2,207 | 3.8% |
| Central Sulawesi | 1,243 | 2.1% |
| South Sulawesi | 1,187 | 2.0% |
| East Nusa Tenggara | 1,028 | 1.8% |
| Southeast Sulawesi | 1,018 | 1.8% |
| Bangka-Belitung Islands | 822 | 1.4% |
| West Nusa Tenggara | 771 | 1.3% |
| Lampung | 672 | 1.2% |
| Jambi | 613 | 1.1% |
| East Java | 550 | 0.9% |
| North Sulawesi | 336 | 0.6% |
| Gorontalo | 174 | 0.3% |
| Central Java | 165 | 0.3% |
| West Java | 155 | 0.3% |
| West Sulawesi | 145 | 0.2% |
| North Kalimantan | 118 | 0.2% |
| Riau | 81 | 0.1% |
| Banten | 45 | 0.1% |
| Bali | 10 | 0.0% |
| North Sumatra | 10 | 0.0% |
| Riau Islands | 9 | 0.0% |
| Special Region of Yogyakarta | 7 | 0.0% |
| Aceh | 6 | 0.0% |
| Bengkulu | 6 | 0.0% |
| West Sumatra | 6 | 0.0% |
| Jakarta Special Capital Region | 2 | 0.0% |
- Period
- 29 Sep–5 Oct 2026 UTC · snapshot retrieved 7 Oct 2026
- Aggregation
- 58,099 records · all confidence levels · project province labels
- Limitations
- Detections are not confirmed fires or burned area. Older boundary labels are retained.
Decisions that keep context visible
A fixed snapshot makes the exhibit reproducible. Counts keep the first comparison simple; a daily-share view then tests whether the weekly concentration holds evenly through time. It does not.
The application separately groups nearby detections with approximately 5 km DBSCAN clustering and tracks them across days. Its monitoring-priority ranking combines activity, radiative power, persistence, and growth. I keep that heuristic ranking separate from this descriptive exhibit: it is not an official fire-risk score.
A concentration worth examining
Central Kalimantan contributes 14,530 of 58,099 detections: 25.0%, the largest provincial total in the selected week. Its daily share ranges from 3.2% to 37.0%, so the weekly figure conceals substantial day-to-day variation.
The defensible conclusion is limited to recorded thermal activity in this snapshot. It identifies a useful starting point for further investigation; it does not rank confirmed incidents, determine their cause, or measure their severity.
What the evidence cannot say
Repeat observations can describe the same source. Clouds, smoke, overpass timing, pixel size, and detection thresholds influence coverage. Confidence describes the satellite retrieval, not incident severity. Detection counts are neither burned area nor an area-adjusted risk measure.
The exhibit retains the repository’s older province labels. The map backdrop uses geoBoundaries’ 2017 ADM1 reference; it does not imply current administrative divisions. The published snapshot also inherits the project’s spatial-assignment and refresh behavior.
The live pipeline is scheduled every three hours, with a separate previous-day refresh. A successful refresh need not contain a newer satellite acquisition. Near-real-time records can change, and a seven-day sample cannot establish a seasonal baseline.
Further exploration
The next useful comparison is sensitivity to confidence filtering, followed by weather, land cover, and a longer seasonal baseline. Those additions could help explain the observed concentration; they are not evidence supplied by this exhibit.
Explore the public dashboard for alternative time and province selections, or inspect the repository to follow the transformations and monitoring heuristics.
Personal contribution
I built the public dashboard and automated pipeline: ingesting NASA FIRMS data, assigning regions, aggregating observations, and tracking repeated activity.