
Muhammad Naufal · Data & Operations Analyst

Making complex systems understandable.

Data & Operations Analyst working across analytics, satellite telecommunications, geospatial data, automation, and software.

Featured project Personal project

KarhutlaWatch

Satellite thermal detections, placed in geographic and temporal context across Indonesia.

Investigation question

Where and when do satellite fire detections concentrate across Indonesia?

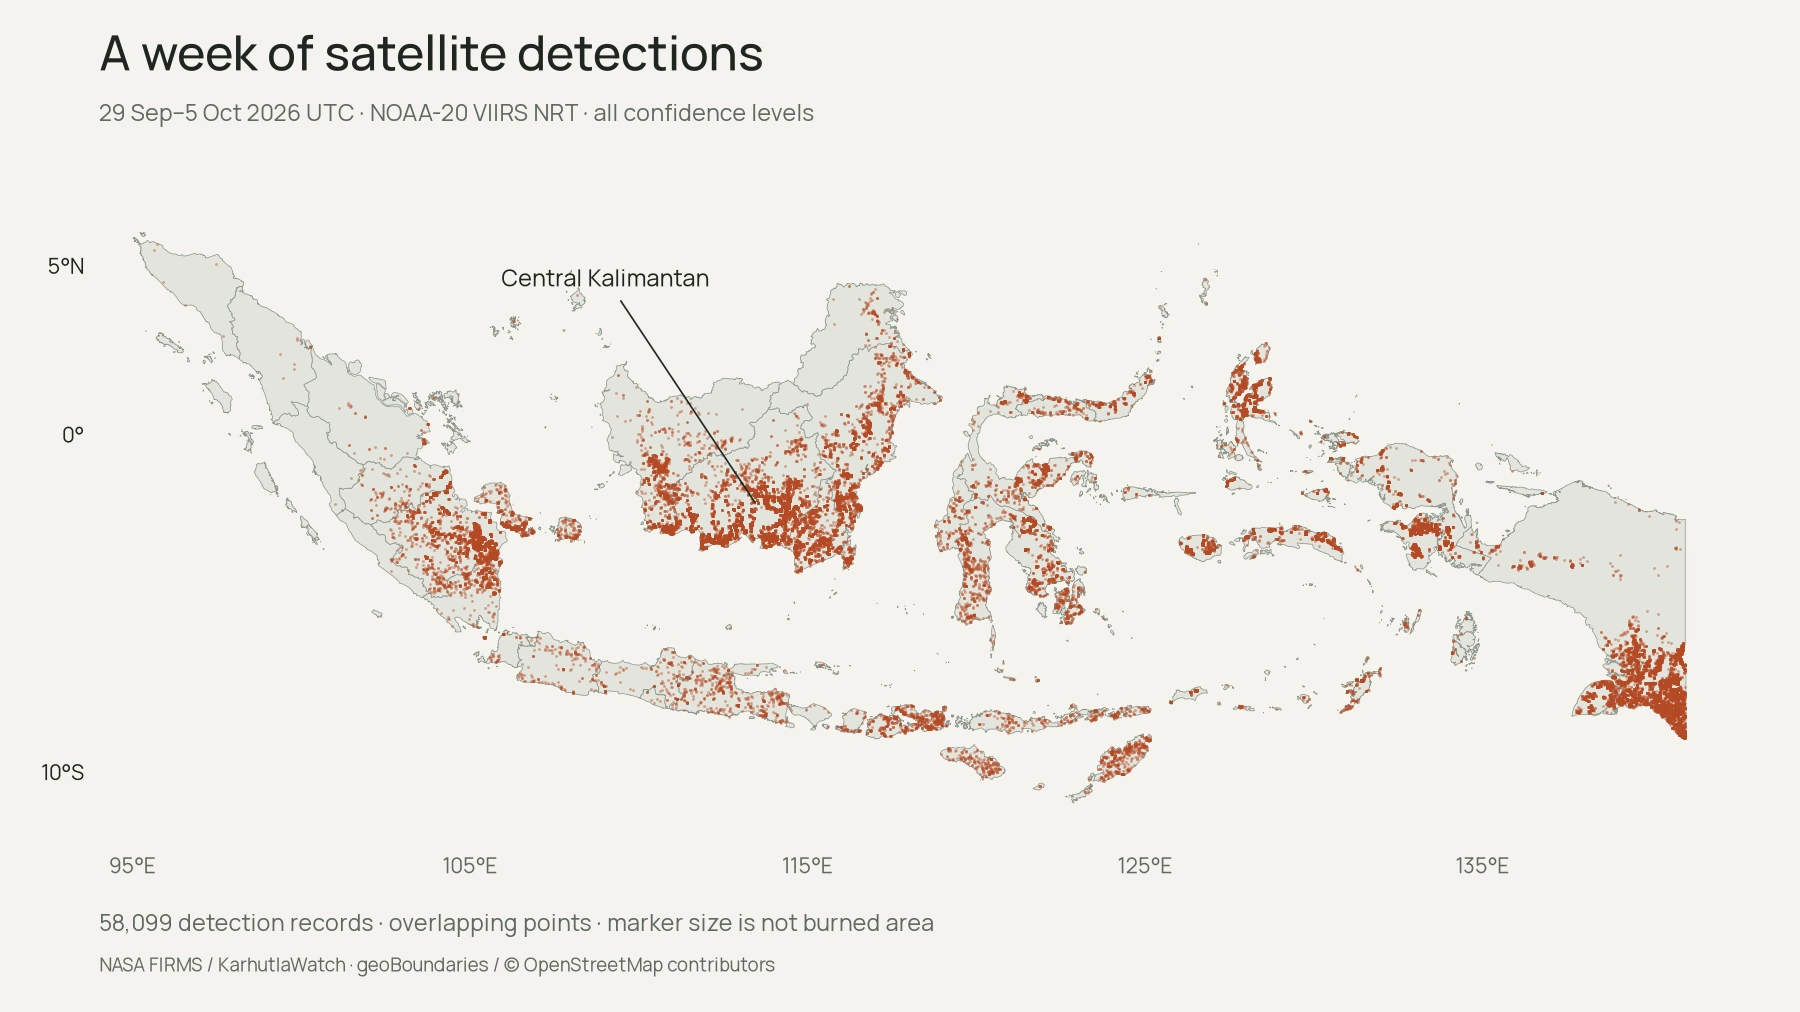
Indonesia map of 58,099 satellite thermal-detection records for 29 September–5 October 2026. Concentrations appear in southern Kalimantan, southern Sumatra and southern Papua.
View data table
Detection records by project province label, 29 September–5 October 2026 UTC. All confidence levels.
ProvinceDetectionsShare
Central Kalimantan14,53025.0%
Papua9,69516.7%
South Sumatra7,99813.8%
West Papua4,0126.9%
East Kalimantan3,2505.6%
Maluku2,5394.4%
South Kalimantan2,4744.3%
North Maluku2,2153.8%
West Kalimantan2,2073.8%
Central Sulawesi1,2432.1%
South Sulawesi1,1872.0%
East Nusa Tenggara1,0281.8%
Southeast Sulawesi1,0181.8%
Bangka-Belitung Islands8221.4%
West Nusa Tenggara7711.3%
Lampung6721.2%
Jambi6131.1%
East Java5500.9%
North Sulawesi3360.6%
Gorontalo1740.3%
Central Java1650.3%
West Java1550.3%
West Sulawesi1450.2%
North Kalimantan1180.2%
Riau810.1%
Banten450.1%
Bali100.0%
North Sumatra100.0%
Riau Islands90.0%
Special Region of Yogyakarta70.0%
Aceh60.0%
Bengkulu60.0%
West Sumatra60.0%
Jakarta Special Capital Region20.0%

The geographic view

Enlarged figure. Scroll within the image to inspect its full extent.

A week of NOAA-20 observations, kept at their recorded locations. Overlapping points show where detections concentrate; the table gives provincial totals.

Period
29 Sep–5 Oct 2026 UTC · snapshot retrieved 7 Oct 2026
Aggregation
58,099 records · all confidence levels · project province labels
Limitations
Detections are not confirmed fires or burned area. Older boundary labels are retained.
Public data snapshot

Purpose

Satellite thermal detections, placed in geographic and temporal context across Indonesia.

Personal contribution

I built the public dashboard and automated pipeline: ingesting NASA FIRMS data, assigning regions, aggregating observations, and tracking repeated activity.

Further investigations

Selected Work

More public and personal work.

All projects

QuadLake Indonesia

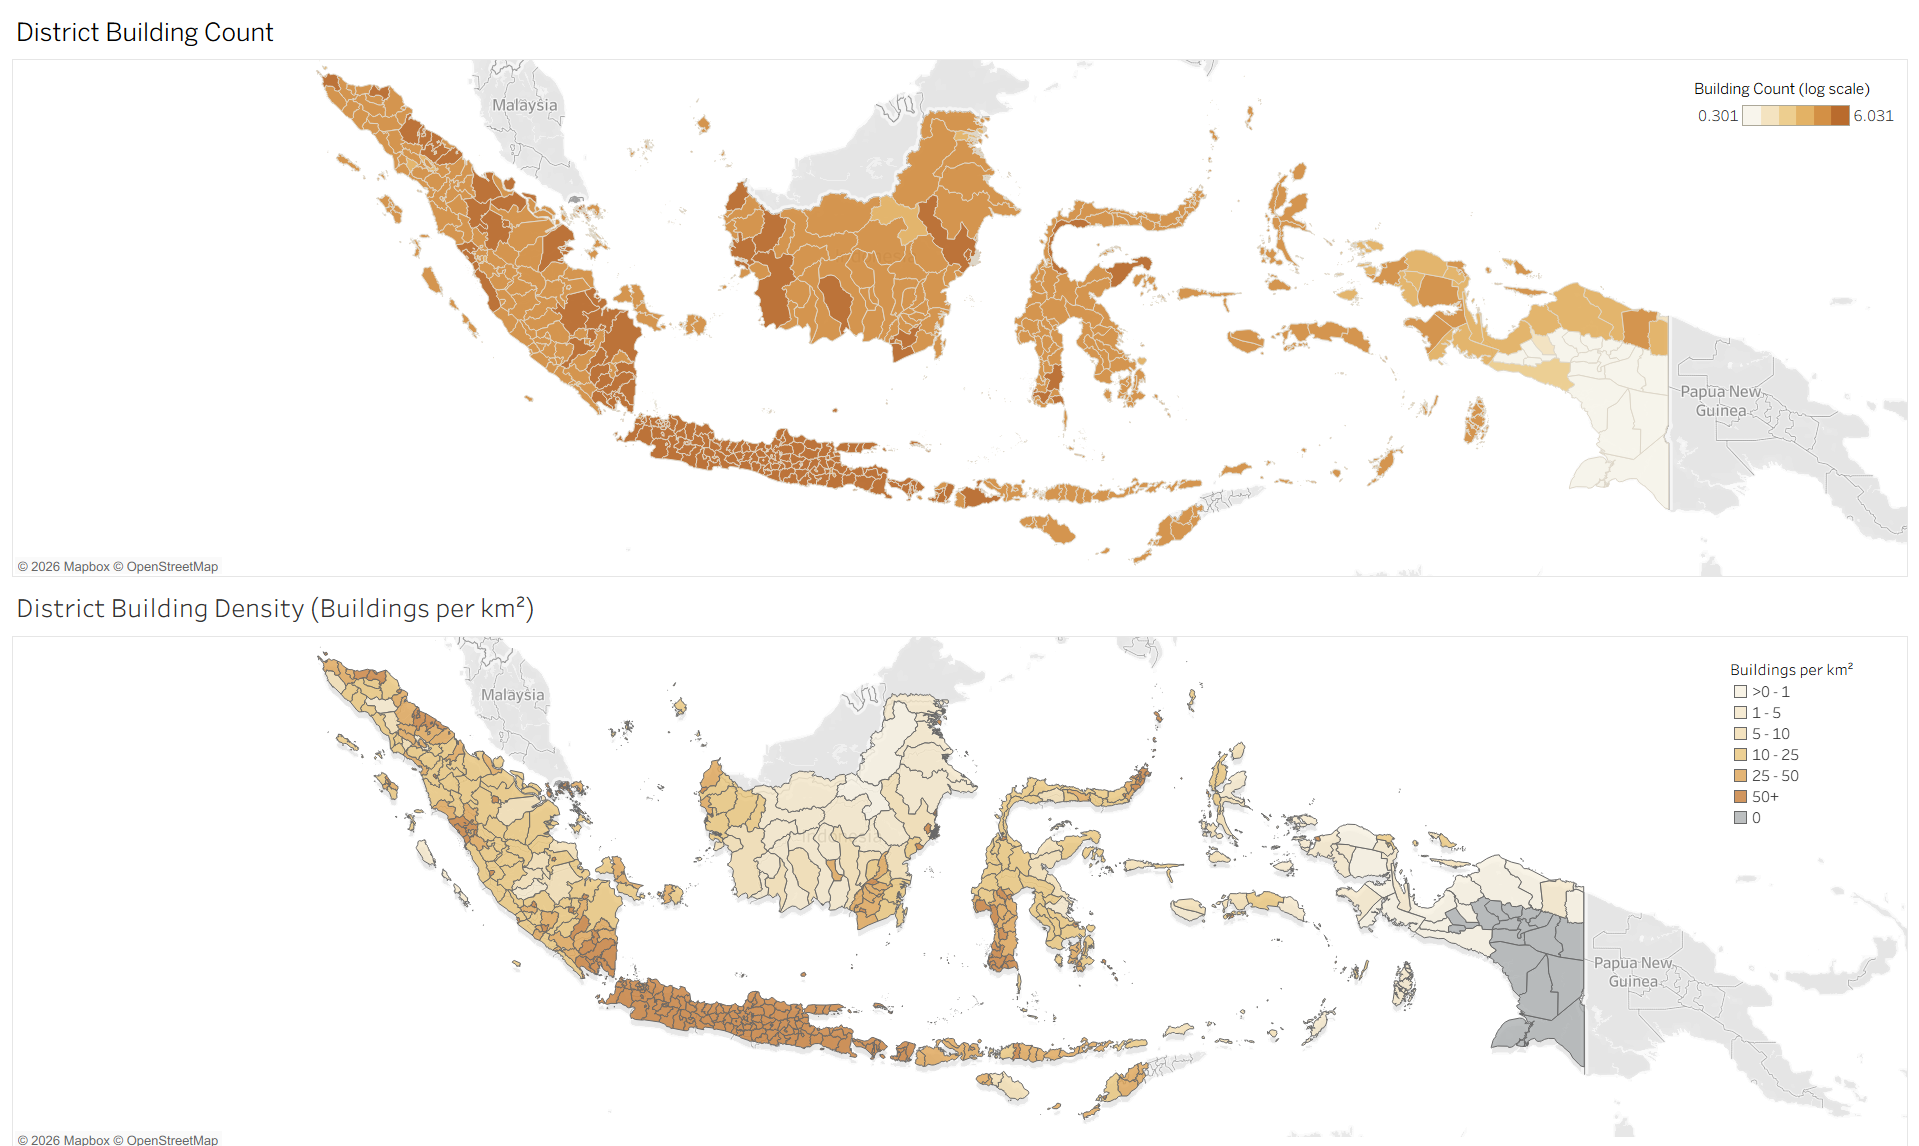
Original QuadLake Tableau export comparing district building-footprint counts and density across Indonesia.

Personal project

Turning fragmented building-footprint files into inspectable regional reporting data.

I built the Bronze, Silver, and Gold pipeline and CLI, with validation, spatial assignment, and reconciled reporting outputs.

Read case study

About & experience

Analytics, with operational context.

I’m Muhammad Naufal, a Data & Operations Analyst with a professional background in satellite telecommunications.

I build BI dashboards and reporting automation with Python and SQL. In my personal projects, I explore geospatial data—from satellite thermal detections to building-footprint pipelines.

Portrait of Muhammad Naufal
  1. Service Operations — Data & Operations Analyst

    Pasifik Satelit Nusantara Jan 2024 – Present

    Develop BI dashboards, automate reporting with Python and SQL, and validate data for satellite telecommunications operations. Work with cross-functional teams to clarify reporting requirements.

  2. Assistant Project Manager

    Pasifik Satelit Nusantara Jun 2022 – Jan 2024

    Translate cross-functional requirements into acceptance criteria, coordinate testing and user acceptance, and support project delivery and handover documentation.